Residential Real Estate Trends
This chart shows the "middle" price point of a group of properties that have successfully Sold (i.e., closed escrow) each month, i.e. half sold for more and half sold for less than the median price. Tracking the movement of median prices over time provides a good visual indicator of the direction market forces are moving prices.
The percentage columns in the grid below the chart compare the beginning month of the report time period to the ending month. The arrow points up if the change value is positive (shown in green text) and down if the change value is negative (shown in red text). A double-ended horizontal shape displays if there is no percentage change.
Click HERE to look at a full sample report.
Median Sold Price by Month of Single Family Residences
San Bernardino County |
| August-09 vs. August-11: The median sold price is up 11% |
|
|
| August-09 vs. August-11 |
| 157,000 |
175,000 |
18,000 |
+11% |
|
|
+11% |
|
|
Median Sold Price by Month of Single Family Residences
Riverside County |
| August-09 vs. August-11: The median sold price is up 11% |
|
|
| August-09 vs. August-11 |
| 180,500 |
200,000 |
19,500 |
+11% |
|
|
+11% |
|
|
Median Sold Price by Month of Single Family Residences
Los Angeles County |
| August-09 vs. August-11: The median sold price is down 1% |
|
|
| August-09 vs. August-11 |
| 360,000 |
355,000 |
5,000 |
-1% |
|
|
-1% |
|
|
Median Sold Price by Month of Single Family Residences
Orange County |
| August-09 vs. August-11: The median sold price is down 4% |
|
|
| August-09 vs. August-11 |
| 520,250 |
499,000 |
21,250 |
-4% |
|
|
-4% |
|
|
For Commercial Real Estate Trends, click on the following image:
|
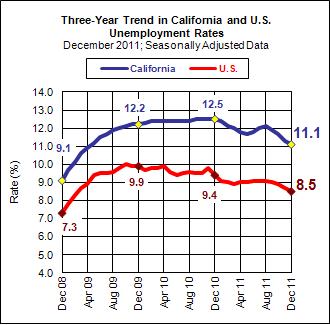
For Unemployment Data, click on the following image:
 |
|


